The Work Nobody Sees: How I Ran 47 Experiments to Make PlantLab's AI Better
The Short Version
PlantLab's AI doesn't ship once and stop improving. Behind every release is a cycle of automated experiments that audit the model's own predictions, find where it struggles, and fix the root causes before retraining. The latest cycle ran 47 hyperparameter experiments, analyzed 1,081 classification errors, and cleaned data across 1.34 million images. This is what continuous AI improvement actually looks like – no buzzwords, just the work.
Most AI Products Stop After Training
Here's something most AI companies would prefer you didn't think about: they train a model once, wrap it in an API, and never touch the internals again. Updates mean prompt tweaks or UI changes. The underlying model, the thing that actually makes predictions, stays frozen.
For general-purpose tools, this is fine. But for plant health diagnosis, where the difference between potassium deficiency and magnesium deficiency is a few pixels of vein color, “fine” means wrong often enough that growers stop trusting it. And they should. A diagnosis tool that's right 90% of the time is wrong one in ten. That's not a rounding error when you're deciding whether to flush your nutrients.
PlantLab takes a different approach. Every few weeks, the model goes through a structured improvement cycle. Not a full retrain from scratch – a targeted investigation that finds specific weaknesses, fixes them, and measures whether the fix actually worked.
How the model audits itself
The improvement cycle has three phases that feed into each other.
First, find the errors. Run the current production model against its own training data. Every disagreement, where the model's prediction doesn't match the training label, gets flagged for review. In the most recent audit, I ran 109,000 original images through the model and logged every mismatch.
Then, understand the errors. Not all errors are equal. A confusion analysis maps which classes the model mixes up and how often. In the last analysis, I found 1,081 errors across 31 condition classes. But the distribution was revealing: 10 classes had zero errors (solved problems), while potassium deficiency alone accounted for 216 errors, confusing it with nearly every other nutrient class and even spider mites.
Then, fix the root cause. Sometimes the model is wrong. Sometimes the training label is wrong. When you find 53 mutual errors between potassium deficiency and spider mites, the question isn't “why is the model confused?” but “are these images actually labeled correctly?” In many cases, they weren't. Clean the labels, retrain, and the confusion drops.
Then repeat. The model gets better, which means it catches more labeling mistakes in the next audit cycle, which means the next retrain starts from cleaner data. Each cycle produces better data, not just a better model.
47 Experiments and a humbling lesson
The most satisfying failure in this process came from hyperparameter tuning, which is the process of finding the optimal learning rate, regularization strength, and other training knobs that control how a model learns. I say “satisfying” because it looked like a win at every step until it wasn't.
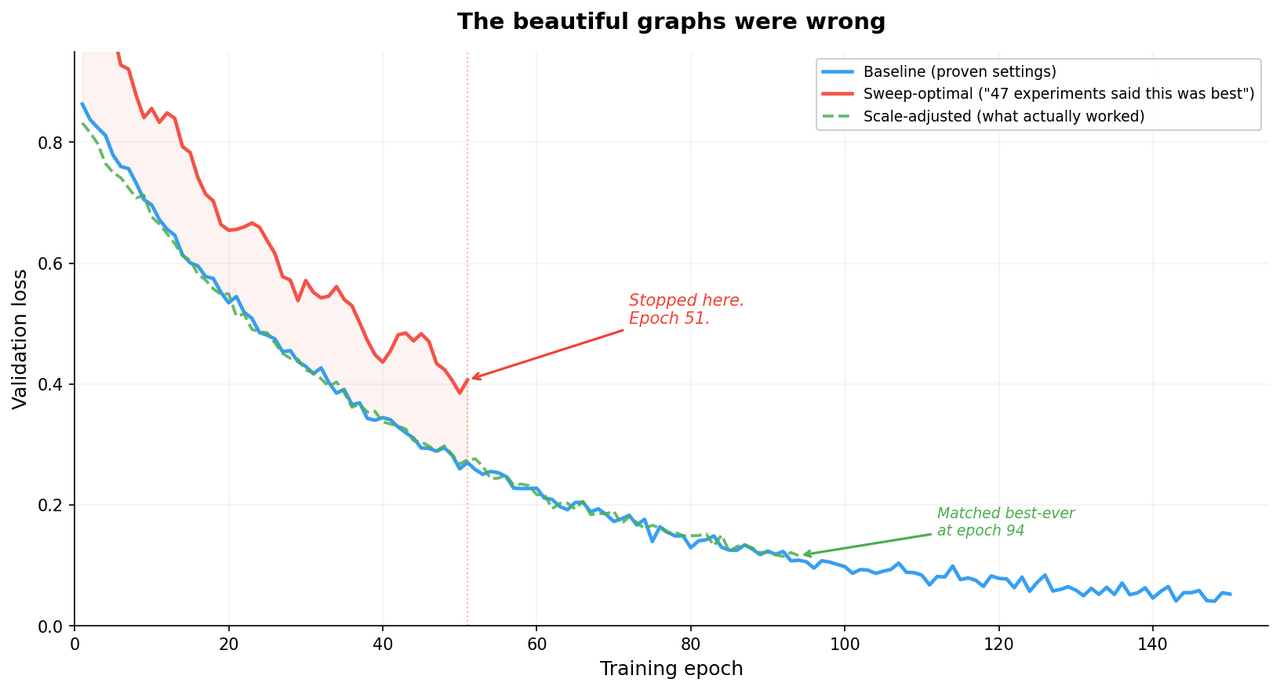
I built an automated sweep system that tests different hyperparameter combinations on a small subset of data (5% of images, 20 training epochs). It ran 47 experiments across four campaigns, testing at three different image resolutions, over about 23 hours of GPU time. Zero crashes. Clean, repeatable results. The optimal settings were clear: a learning rate of 1e-4, no label smoothing, moderate dropout. I had graphs. They were beautiful.
Then I applied those “optimal” settings to a full training run, all 554,000 images, 150 epochs, and it performed worse than my baseline at every single checkpoint. I stopped 51 epochs in, which is the machine learning equivalent of pulling over and admitting you're lost.
So what happened?
The small-scale sweep and the full-scale training are different worlds. At 5% data and 20 epochs, the model barely has time to memorize the training set, so regularization – techniques that prevent overfitting – doesn't help much. At 100% data and 150 epochs, the model has seen every image hundreds of times, and regularization becomes essential. The settings that were optimal for a quick experiment were actively harmful at production scale.
It's a well-known trap that I walked into with my eyes open: optimizing on a proxy (small, fast experiments) and assuming the results transfer to the real thing (full-scale training). The numbers look scientific. The methodology is sound. And the conclusion is wrong. I knew this was a risk. I ran the full-scale experiment anyway because “it'll probably be fine” is the most expensive sentence in machine learning.
What Actually Worked
I quantified the gap by computing a “regularization score” – a single number that captures the combined effect of learning rate, label smoothing, and dropout. The sweep-optimal settings had a regularization score 150% higher (less regularized) than my proven baseline. That magnitude of change isn't an optimization – it's a regime shift.
The fix was to use the sweep's directional findings (which hyperparameters matter most, which direction they should move) but anchor the absolute values to what had already worked at full scale. I nudged the learning rate up by 20% instead of doubling it. Halved the label smoothing instead of eliminating it. Kept the dropout finding because dropout's effect is per-batch, not scale-dependent.
The result: the scale-adjusted settings matched our best-ever model at epoch 94, with lower volatility throughout training. Not a breakthrough. A boring, reliable improvement. Which, if you've been doing this long enough, is what you actually want.
The Potassium Problem
The confusion analysis had one standout finding, and it wasn't what I expected.
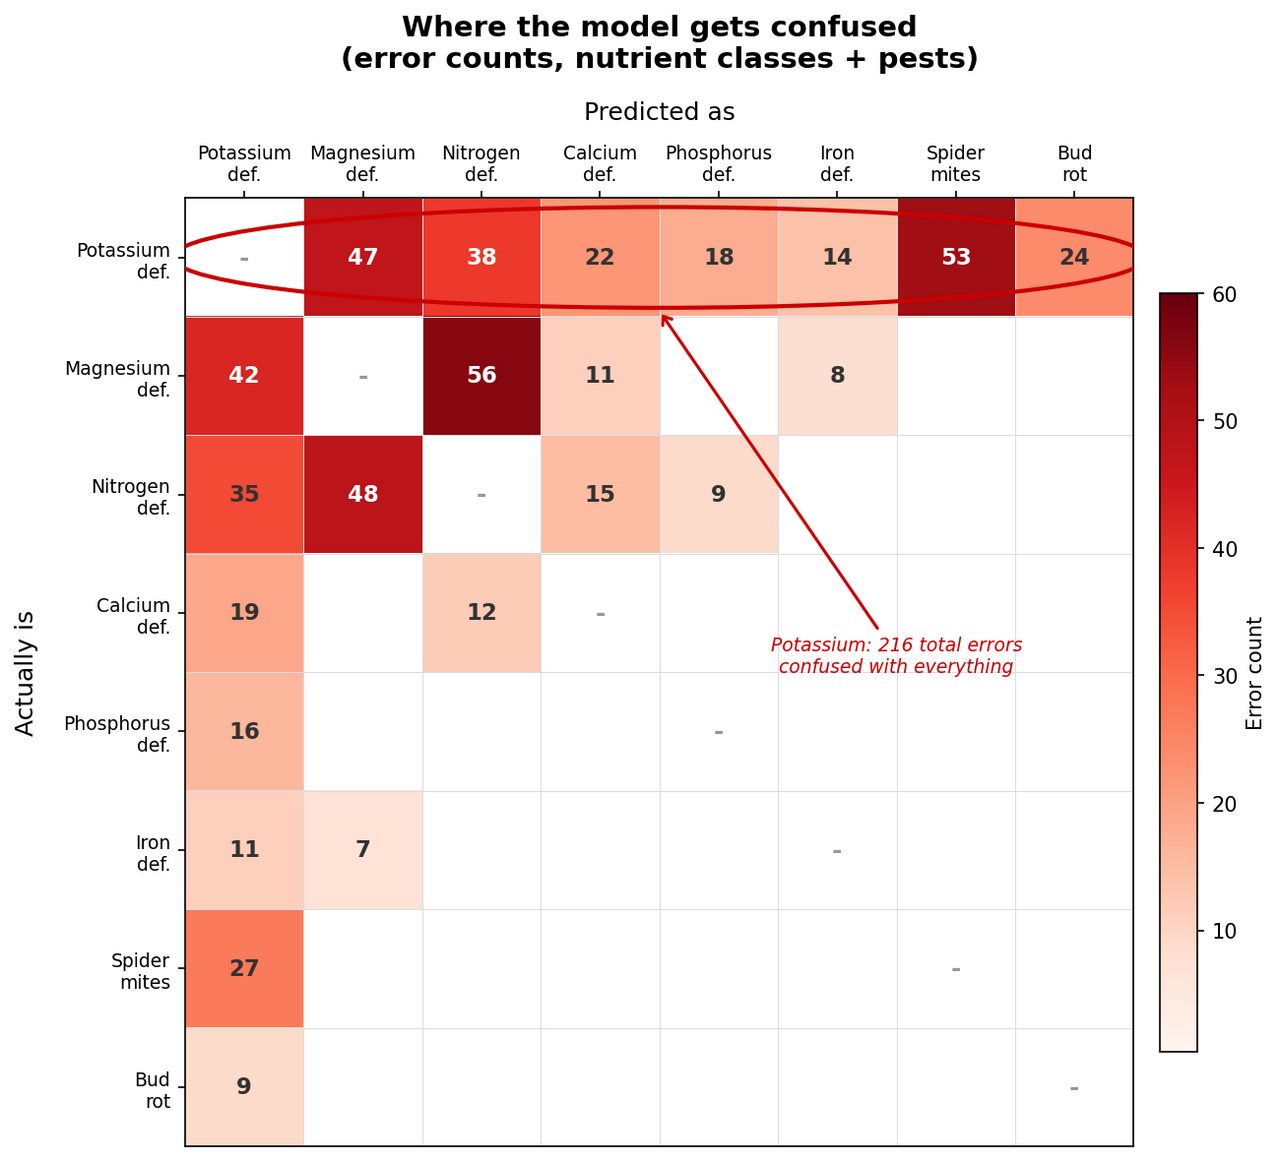
Across 31 condition and pest classes, potassium deficiency was the single worst performer: 216 errors, confused with magnesium, nitrogen, calcium, phosphorus, iron, spider mites, and bud rot. Potassium deficiency was apparently everything and nothing at once. The top three nutrient confusion pairs (magnesium-nitrogen, magnesium-potassium, nitrogen-potassium) accounted for 30% of all model errors.
This wasn't a model failure. It was a data quality signal.
When potassium deficiency shows 53 errors with spider mites in one direction (top row) and 27 in the other (left column) – a completely different category – the model isn't confused about biology. The training images are. Someone labeled a photo “potassium deficiency” when it actually showed spider mites, or (more often) showed both. Real-world plants don't politely have one problem at a time. A plant stressed by potassium deficiency is more susceptible to spider mites, and the photo shows symptoms of both. Good luck labeling that at 2 AM.
The fix isn't a better model. It's better labels. I built a label review pipeline that uses two independent AI systems to re-examine every flagged image. When both agree the label is wrong, it gets fixed. When they disagree, a human reviews it. This process cleared 4.8% of the training set as mislabeled or ambiguous in the most recent pass.
4.8% sounds small. But 4.8% of 1.34 million images is over 64,000 images that were confidently teaching the model the wrong answer. That's not a rounding error. That's a second, dumber teacher in the room.
What 10 Solved Classes Tell You
The confusion analysis also revealed something encouraging: 10 of the 31 classes had exactly zero errors. Underwatering, mosaic virus, boron deficiency, fungus gnats, leafhoppers, mealybugs, several others – the model has learned these perfectly on the validation set.
These classes share two things: they have visually distinctive symptoms (mosaic virus produces unmistakable leaf patterns) and their training labels are high quality (less ambiguity means less labeling disagreement). This confirms the theory: when the data is clean, the model architecture is more than capable. The bottleneck is data quality, not model capacity.
This is why I spend my time cleaning data instead of chasing bigger models. A model with 10 times more parameters trained on the same noisy data will make the same mistakes, just with more confidence. Confidently wrong is worse than uncertain.
Why This Matters for Your Plants
You will never see any of this. You upload a photo, you get a diagnosis in milliseconds. Nobody has ever opened an app and thought “I bet they ran 47 hyperparameter experiments to calibrate this.” Nor should they.
But it's why PlantLab can tell potassium deficiency from magnesium deficiency, a distinction that experienced growers argue about in person, and that general-purpose AI tools get wrong with total confidence. It's why the accuracy number (99.1% across all 31 classes) is measured equally across every condition, not inflated by the easy ones. And it's why that number moves up instead of staying frozen at whatever the first training run produced.
Not sure what's wrong with your plant? Try the current model free at plantlab.ai. Three diagnoses a day, results in under a second.
FAQ
How often does PlantLab retrain its models?
I run improvement cycles every few weeks. Each cycle includes a confusion analysis, data audit, and targeted label review before retraining. A full retrain takes 3-5 days of GPU time.
What's the difference between PlantLab's approach and fine-tuning a general AI model?
General-purpose vision models like GPT or Gemini were trained on billions of general images. Fine-tuning adjusts them slightly for a new task. PlantLab trains purpose-built models from scratch on 200,000+ cannabis images, using a 4-stage pipeline where each model answers one specific question. This gives us direct control over training data quality, confusion pairs, and accuracy metrics.
Why not just use a bigger model?
Bigger models don't fix noisy labels. They memorize them more effectively, which is worse. The bottleneck is data quality, not model capacity. A targeted label review that fixes 64,000 mislabeled images improves accuracy more than doubling model size. And smaller, specialized models run in 18 milliseconds instead of 2-5 seconds, which matters when you're trying to automate anything.
Can I see PlantLab's accuracy data?
I publish 99.1% balanced accuracy across 31 condition and pest classes, measured equally across all classes. I also publish where the model struggles. Potassium and magnesium confusion remains the hardest visual distinction.