Nutrient Antagonism in Cannabis: Why Chasing Deficiencies Makes Things Worse
The Short Version
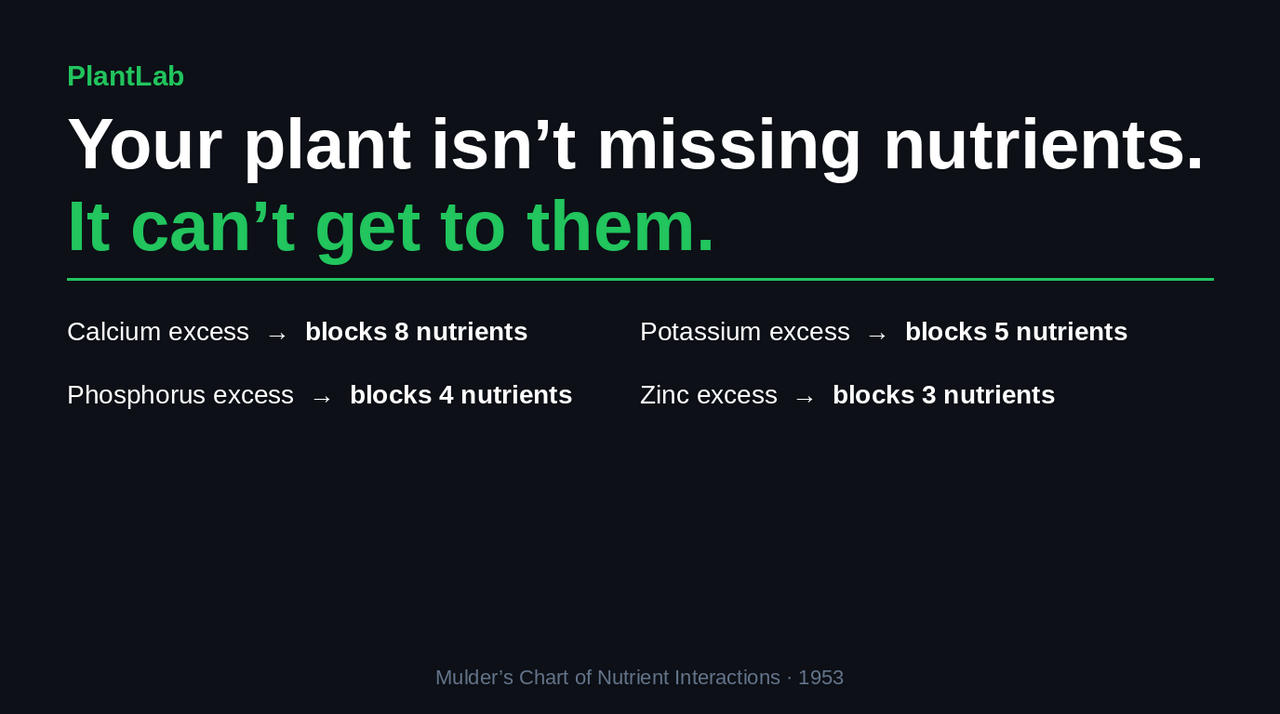
Nutrient antagonism is when excess of one nutrient physically blocks another from being absorbed – your plant has enough of what it needs, it just can't get to it. Adding more of the blocked nutrient usually makes things worse. A 1953 agricultural chart called the Mulder's Chart maps all of these interference relationships; PlantLab's diagnosis now applies that same logic automatically, flagging the most likely excess nutrient in every analysis.
What this post covers: – Why “add more” is sometimes the exact wrong answer – The Mulder's Chart: what it shows and how to read it – The four antagonism traps cannabis growers hit most often – How to tell antagonism from a true deficiency – What to actually do once you've identified the likely excess
You're three weeks into flower. New growth is showing interveinal chlorosis – yellowing between the veins. Classic iron deficiency. You've seen it before. You adjust your pH, add some chelated iron, wait a few days. Nothing. You add more. The leaves get worse. Two weeks of this and your runoff EC looks completely normal. What is going on?!
Here's the thing: your plant probably has plenty of iron. The problem is that something else is blocking it from getting in. You're chasing a deficiency that isn't really there.
That's nutrient antagonism – and it's the reason “add more nutes” is sometimes the exact wrong answer.
Why Adding More Makes It Worse
Plant roots absorb nutrients as ions through specific transport proteins – essentially tiny gates in the root membrane, each specific to particular ions. The problem is that some ions are chemically similar enough to compete for the same gate.
Calcium (Ca²⁺) and magnesium (Mg²⁺) compete directly. Iron (Fe²⁺) and manganese (Mn²⁺) compete. Phosphate and zinc compete. When one is present in excess, it floods the available uptake pathways and crowds out the competition. The blocked nutrient can be sitting right there in your solution at perfectly normal levels – the plant just can't get it through.
Think of it like a packed venue with a capacity limit. Having more people waiting outside doesn't get anyone in if the wrong crowd already filled the room.
Your nutrient solution looks fine on paper. Your runoff TDS is normal. But the plant is effectively starved of the blocked nutrient. When you add more of the blocked nutrient, you're just adding more people to the outside line.
The fix is not to add more of the blocked nutrient – it's to reduce the excess that's doing the blocking.
The Mulder's Chart: 70+ Years of This Being a Known Problem
In 1953, agricultural researcher Cornelis Mulder published an analysis of how essential plant nutrients interfere with each other. The interactions he mapped have been confirmed and refined by plant scientists ever since. Farmers and agronomists have used the resulting chart as a standard diagnostic tool for decades.
Most cannabis growers have never heard of it.
Here's the cannabis-relevant subset, derived from the interaction patterns that show up most in real-world growing:
| If you have excess of... | It blocks uptake of... |
|---|---|
| Calcium | Boron, Iron, Magnesium, Manganese, Phosphorus, Potassium, Sulfur, Zinc |
| Phosphorus | Copper, Iron, Manganese, Zinc |
| Potassium | Boron, Calcium, Magnesium, Nitrogen, Phosphate |
| Nitrogen (toxicity only)* | Boron, Copper, Potassium |
| Zinc | Copper, Iron, Manganese |
| Iron | Manganese |
| Manganese | Iron |
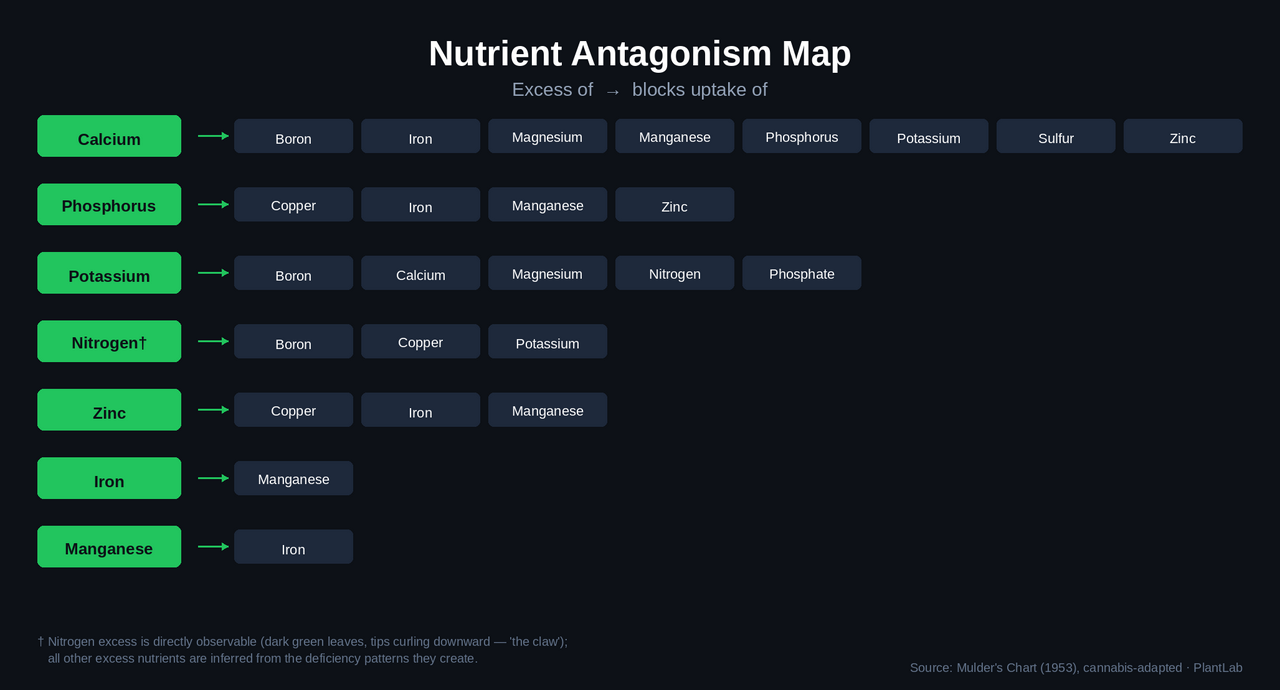
Calcium is the overachiever – it can block uptake of nearly everything else. This is also why CalMag can backfire when calcium is already the problem.
One important distinction about nitrogen: it's the most visually distinctive excess in this table. While every other entry can only be inferred from the deficiencies it creates, nitrogen toxicity has its own unmistakable signature – dark green, shiny leaves with tips curling downward, the “claw.” You can't look at a plant and spot phosphorus excess; you see iron and zinc and manganese deficiency appearing together, and you work backwards from that.
The Four Traps Cannabis Growers Hit Most
The following are the scenarios you'll recognize from forum threads, grow journals, and that one grow that made you seriously question everything.
Trap 1: The Calcium-Magnesium See-Saw
Magnesium deficiency and calcium deficiency share visual overlap in early stages – interveinal chlorosis, lower leaves first. The forum answer is CalMag. CalMag works great when both calcium and magnesium are actually depleted. The problem: if calcium is already elevated (hard tap water, previous CalMag doses stacking, heavy base feed), adding more calcium deepens the antagonism against magnesium uptake. The magnesium deficiency gets worse, you add more CalMag, calcium climbs higher, and you're doing laps around the same problem.
The lesson isn't that CalMag is bad. It's that the same supplement that fixes a true Ca/Mg deficiency actively worsens a calcium-driven lockout.
Trap 2: The Phosphorus Stack
Late veg or early flower: you flush the plant, then hit it with a P-heavy bloom formula to push the transition. Phosphorus accumulates fast. Now iron, zinc, and manganese uptake are all suppressed simultaneously. Three separate deficiency symptoms appearing in the same growth period, on new leaves, none of them responding to treatment – that pattern almost always points to one excess, not three separate missing nutrients.
Trap 3: The Hard Water Baseline
Tap water at 200+ ppm calcium (common in many regions) puts you at or above the antagonism threshold before you've added a single ml of nutrients. Your nutrient line looks balanced on the label, but calcium is already dominating the root zone before the grow starts. By mid-flower, everything from magnesium to iron to zinc is struggling. Check your source water with a TDS meter before spending two weeks blaming your feeding schedule.
Trap 4: Soil Buildup
Amended soil and organic media are forgiving by design – but they accumulate phosphorus and potassium over time. By week 6 or 7 of flower, even a conservative feed is compounding on top of weeks of residual buildup. Micronutrient lockout becomes predictable. If your soil grows have historically gone sideways in late flower despite clean feeding, this is the first thing to look at.
Antagonism or True Deficiency: How to Tell
If the problem is antagonism, adding more of the deficient nutrient won't fix it – and may accelerate the decline. Use these signals to read the situation:
Signs you're probably dealing with antagonism: – You already added the deficient nutrient and symptoms didn't improve or got worse (i.e. stop, just stop!) – The symptom pattern matches a known antagonism pair from the table above (i.e. hey, that's it) – Multiple micronutrient deficiencies appeared at the same time, not sequentially (i.e. why does this happen to me) – Runoff EC/TDS is elevated (i.e. I knew it!) – You've been stacking the same formula for several weeks without a flush or reset (i.e. it worked before, what gives?)
Signs it's probably a true deficiency: – Fresh grow, new medium, feeding hasn't been aggressive – Runoff EC is low – Single deficiency symptom, nothing else overlapping – Deficiency appeared early in the cycle when soil is still fresh
The diagnostic question to ask yourself: “I'm seeing [symptom]. What have I been feeding heavily that might be blocking this?” If the Mulder's table shows a plausible answer, that's your starting point.
What to Do When You Suspect Antagonism
- Stop adding the blocked nutrient. More iron won't fix iron lockout.
- Identify the likely excess using the table above. What have you been stacking?
- Reduce that input. In DWC, replace the reservoir and mix fresh at lower concentration. In coco, back off feed strength and let runoff EC drop. In soil, a water-only cycle at half strength is usually enough to start clearing it.
- Let runoff EC normalize before resuming full feeding.
- Reintroduce the blocked nutrient at a conservative dose once the excess has cleared.
Don't automatically reach for a full aggressive flush. Antagonism builds gradually and usually unwinds gradually too. You're correcting a balance issue, not nuking the root zone – unless the situation is severe, ease into it.
How PlantLab Applies Mulder's Chart
PlantLab's /diagnose endpoint detects individual nutrient deficiencies from photos. When we built the nutrient subclassifier, the hardest cases weren't single deficiencies – they were patterns where three or four micronutrients were suppressed simultaneously. Those cases almost always had a single excess driving them, not three separate missing nutrients.
So we encoded the Mulder's Chart antagonism graph directly into the analysis layer. Every diagnosis now returns a mulders_hypotheses field: a ranked list of the most likely excess-nutrient candidates, inferred from the co-occurring deficiency pattern.
Here's what that looks like in practice. If the model detects iron deficiency + zinc deficiency + manganese deficiency in the same image:
{
  "mulders_hypotheses": [
    {
      "excess": "phosphorus_excess",
      "explains": ["iron_deficiency", "zinc_deficiency", "manganese_deficiency"],
      "evidence": 2.38,
      "evidence_count": 3
    },
    {
      "excess": "calcium_excess",
      "explains": ["iron_deficiency", "zinc_deficiency", "manganese_deficiency"],
      "evidence": 2.38,
      "evidence_count": 3
    },
    {
      "excess": "zinc_excess",
      "explains": ["iron_deficiency", "manganese_deficiency"],
      "evidence": 1.61,
      "evidence_count": 2
    }
  ]
}
Example reflects multi-label nutrient detection shipping in the next release.
The evidence score is the sum of confidence scores for each condition the excess would explain. Phosphorus and calcium both explain all three deficiencies equally in this example – both rank first. Zinc excess only explains two of the three, so it ranks lower.
This is a hypothesis, not a measurement. The model doesn't have access to your water report, feeding history, or what's in your soil. What it gives you is a starting point: here's which excess is most consistent with the visual pattern. For most growers, that's the hardest part of the diagnosis loop – not knowing which direction to even look.
For growers running API-driven automation – Home Assistant, Node-RED, custom controllers – the mulders_hypotheses field maps directly to an action: phosphorus_excess → reduce P in next feed. The diagnosis points you to the problem; your setup handles the correction.
Limitations
This is inference, not measurement. A soil test or water analysis gives you actual numbers. mulders_hypotheses gives you ranked hypotheses based on what the plant looks like. Use it to direct your investigation, not replace it.
pH is a parallel problem. Deficiency symptoms caused by pH outside the optimal range look identical to antagonism symptoms. If your runoff pH is off, fix that first – the Mulder's table won't help you here.
Rare interactions have less training data. Copper deficiency is a newer addition to the model; detection confidence is lower than for iron or nitrogen. Treat copper-related hypotheses with more skepticism until more data accumulates.
Visual overlap is real. Late-stage symptoms, nitrogen toxicity masking other issues, and grow-stage-specific presentation can confuse any visual analysis. If a diagnosis doesn't match what you're seeing, trust your eyes and reach for a test kit.
Related Reading
- Yellow Leaves, Seven Suspects: How PlantLab Got Specific About Nutrient Deficiencies – how the nutrient sub-classifier powering this was built
- Nitrogen Deficiency in Cannabis – the most common deficiency, and how to tell it apart from light deficiency and senescence
Try PlantLab free at plantlab.ai. Create a free account and get 3 diagnoses per day — upload a photo and the diagnosis returns structured JSON: conditions detected, confidence scores, and the mulders_hypotheses field for any nutrient patterns that fit the antagonism graph.