Node-RED + PlantLab: Visual Automation for Your Grow
What You'll Build
A Node-RED flow that captures a photo on a schedule, sends it to PlantLab for diagnosis, and takes action based on the result. Push notifications, dashboard updates, MQTT messages to your controller, log lines into InfluxDB, or whatever combination you want. No Python. No YAML. Nodes and wires.
Setup runs about 25 minutes on a Node-RED instance that's already up. The cost is whatever camera you own plus PlantLab's free tier at 3 diagnoses a day. The output is a structured JSON result: 31 possible conditions, a growth stage, nutrient antagonism hypotheses, and confidence scores, all ready to feed into whatever comes next.
Node-RED suits growers who already have their tent wired up with visual flows. If you've got temp sensors piping into an InfluxDB dashboard, MQTT switches on a power strip, or a Telegram bot that announces fan speed changes, you already know the pattern. Plant health diagnosis is just another node in the chain.
Coming from Home Assistant? There's a tutorial for that too. Node-RED gives you more granular flow control and broader protocol support. HA gives you a cleaner device-and-entity model. Both work. Pick whichever one matches the rest of your setup.
Prerequisites
Before we start:
- Node-RED running (Docker, Pi, bare metal, or the Home Assistant add-on – any of them works)
- A camera that can deliver a JPEG – IP camera with snapshot URL, Frigate, ESP32-CAM, Wyze with RTSP bridge, Reolink, anything that responds to an HTTP GET with a JPEG or that you can shell out to
ffmpegfor - A PlantLab account – sign up free at plantlab.ai, copy your API key from the dashboard
- Optional but recommended:
node-red-dashboardfor a visual panel,node-red-contrib-image-toolsif you want to resize photos before sending, an MQTT broker if your grow controllers talk MQTT
Camera tip: shoot the canopy from above or at a slight angle, with neutral light. Blurple grow lights throw the model off because everything comes out tinted purple. Either schedule the check during a lights-off window or use the camera's built-in flash. PlantLab wants to see actual leaf color, not a magenta smear.
Step 1: The Basic Flow
Here's the smallest flow that actually does something useful. Four nodes. Inject on a schedule, pull an image from the camera, POST to PlantLab, debug-log the result.
[inject: cron 08:00] -> [http request: GET camera.jpg] -> [http request: POST plantlab] -> [debug]
Open Node-RED, drag these four nodes in, and wire them together.
The inject node
- Repeat: at a specific time, 08:00:00
- Payload: empty (we only need the trigger)
The camera snapshot node (HTTP request)
- Method: GET
- URL: your camera's snapshot endpoint, e.g.
http://192.168.1.50/snapshot.jpgor your Frigatehttp://frigate:5000/api/grow_tent/latest.jpg - Return: a binary buffer
If your camera needs auth, add a basic auth header. If it's RTSP-only, use an exec node running ffmpeg -i rtsp://... -frames:v 1 -f image2pipe - and pipe the stdout through.
The PlantLab request node (HTTP request)
- Method: POST
- URL:
https://api.plantlab.ai/diagnose - Return: a parsed JSON object
- Headers: set in the
functionnode below (not in the HTTP request node's UI)
Before this node, drop in a small function node to wrap the binary image as multipart form data and attach the API key header:
const boundary = '----NodeRedBoundary' + Date.now();
const bodyStart = Buffer.from(
    `--${boundary}\r\n` +
    `Content-Disposition: form-data; name="image"; filename="plant.jpg"\r\n` +
    `Content-Type: image/jpeg\r\n\r\n`, 'utf8');
const bodyEnd = Buffer.from(`\r\n--${boundary}--\r\n`, 'utf8');

msg.headers = {
    'X-API-Key': 'YOUR_API_KEY',
    'Content-Type': `multipart/form-data; boundary=${boundary}`
};
msg.payload = Buffer.concat([bodyStart, msg.payload, bodyEnd]);
return msg;
Put your API key in a Node-RED env variable or credentials node instead of hardcoding it. I wrote it inline for clarity.
The debug node
Hook this up to see the full response. You'll get something like this:
{
  "request_id": "req_abc123",
  "schema_version": "1.1.0",
  "success": true,
  "is_cannabis": true,
  "cannabis_confidence": 0.95,
  "is_healthy": false,
  "health_confidence": 0.87,
  "growth_stage": "flowering",
  "growth_stage_confidence": 0.9,
  "conditions": [
    {
      "class_id": "calcium_deficiency",
      "display_name": "Calcium Deficiency",
      "confidence": 0.92
    }
  ],
  "pests": [],
  "mulders_hypotheses": [
    {
      "excess": "potassium_excess",
      "explains": ["calcium_deficiency"],
      "evidence": 0.92,
      "evidence_count": 1
    }
  ]
}
The response can also include diagnostic_confidence, safety_classification, uncertainty_factors, environmental_patterns, and progression_risks. You can ignore the ones you do not need.
One thing worth knowing: the response is trimmed by omission. On a clearly healthy plant, you will NOT see a conditions: [] array – the field is left out entirely. Same with pests and mulders_hypotheses. Always guard with payload.conditions && payload.conditions.length before indexing.
Deploy. Click the inject node's button once to run it manually. If the debug panel shows a response with success: true, the plumbing is done.
Step 2: Branch on the Result
Now it gets interesting. You want different things to happen depending on what the diagnosis came back with. Drop in a switch node right after the PlantLab response, three outputs:
- Property:
msg.payload.is_healthy - Output 1: equals
false(problem detected) - Output 2: equals
true(all good) - Output 3: otherwise (covers the case where the image is not cannabis –
is_healthyis omitted)
Always wire the third branch. If you accidentally point the camera at the lens cap, the wall, or your cat, the API returns is_cannabis: false with is_healthy left undefined. A two-output switch drops those silently. The third output catches them so you can log or send a “check your camera” notification instead.
Most of the work lives on the false branch.
A second switch for confidence
Inside the problem branch, add another switch:
- Property:
msg.payload.conditions[0].confidence - Output 1: >= 0.75 (high confidence – alert)
- Output 2: < 0.75 (marginal – log only)
Early-stage symptoms produce lower confidences. You don't want every 0.4 nitrogen-deficiency blip triggering a Telegram ping at 3 AM.
Step 3: Notifications
Telegram
If you have a Telegram bot set up, drop a telegram sender node on the high-confidence branch. Use a template node before it to format the message:
[ALERT] Plant issue detected

Condition: {{payload.conditions.0.class_id}}
Confidence: {{payload.conditions.0.confidence}}
Growth stage: {{payload.growth_stage}}

Mulder's hypothesis: {{payload.mulders_hypotheses.0.excess}}
Discord
Swap the Telegram node for node-red-contrib-discord-advanced and point it at a webhook. Same template works.
Home Assistant (via webhook)
If you run both HA and Node-RED, Node-RED can fire an HA webhook that triggers a mobile notification with the snapshot attached:
[http request POST: http://homeassistant:8123/api/webhook/plantlab_alert]
The webhook handler in HA does the actual notification. Useful if you already have notification channels, templates, and quiet hours configured over there.
Step 4: Close the Loop
This is where Node-RED pays for itself over a static dashboard. You can fire automations directly from the diagnosis.
Auto-dose Cal-Mag on calcium deficiency
Add a switch on the condition class:
- Property:
msg.payload.conditions[0].class_id - Output 1: equals
calcium_deficiency
Then wire a change node to set the MQTT payload and publish to your dosing pump:
[mqtt out]
  topic: grow/pumps/calmag/set
  payload: ON
Then a delay node (5 seconds), then another MQTT message flipping it back OFF. Always notify yourself when a dosing automation fires. A false positive that dumps nutrients is a bad morning to wake up to.
[set pump ON] -> [delay 5s] -> [set pump OFF] -> [notify]
Ramp up fan speed on fungal detection
If the diagnosis returns powdery_mildew or similar with high confidence, push the fan speed up and drop target humidity in your environmental controller. Same pattern – switch on class_id, change node for the new setpoint, MQTT publish.
Log everything to InfluxDB
Regardless of what happened, log every diagnosis to a time-series database so you can build dashboards later. Drop an influxdb out node on the main line, before the switches. A function node preps the fields:
msg.payload = [{
    is_healthy: msg.payload.is_healthy ? 1 : 0,
    health_confidence: msg.payload.health_confidence,
    top_condition: msg.payload.conditions[0]?.class_id || 'none',
    top_confidence: msg.payload.conditions[0]?.confidence || 0,
    growth_stage: msg.payload.growth_stage
}];
return msg;
Now you have a Grafana dashboard of plant health over time. Symptoms drift slowly over days. Watching a confidence line trending up on one specific condition is more useful than catching the single moment it crosses 0.75.
Step 5: Dashboard
With node-red-dashboard installed, you get a web UI for free. A simple panel:
ui_templateshowing the latest snapshotui_textnodes for condition, confidence, growth stageui_gaugefor overall health confidence- A manual
ui_buttonwired back to the inject node so you can trigger a check on demand
Drop them all in a group called “Plant Health” and they render in a grid at /ui. Pretty enough for the tablet stuck to the kitchen wall.
Putting It Together
The whole flow described in prose:
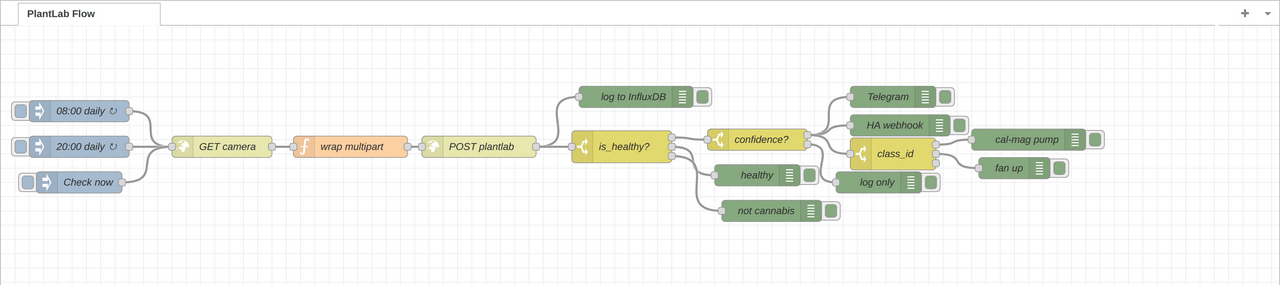
Three triggers feed the same pipeline. Two scheduled injects (morning, evening) and one manual dashboard button. Each trigger pulls a camera snapshot, wraps it as multipart, POSTs to PlantLab, and parses the JSON response. From there the signal fans out. One branch writes every result to InfluxDB so you can graph drift over time. The other branch hits switch: is_healthy. The true side logs and stops. The false side continues into a confidence switch. Low-confidence detections only log. High-confidence detections fan out into Telegram, an HA webhook, and a switch: class_id that routes specific conditions into downstream automations (cal-mag pump on calcium deficiency, fan bump on mildew, whatever you wire up).
One diagnosis call in. One structured log entry. Two scheduled checks, one manual button. Zero or more notifications, zero or more automations fired. All from five node types: inject, http request, function, switch, change.
Troubleshooting
| Problem | Likely cause | Fix |
|---|---|---|
is_cannabis: false |
Camera angle, blurple lights, lens cap | Adjust position, use white light or flash |
| 401 Unauthorized | Missing or wrong API key | Check the X-API-Key header in the wrap-multipart function node |
| 503 Service Unavailable on upload | Image over 10 MB hits the upstream limit before reaching the API | Resize with node-red-contrib-image-tools before the POST. Target under 8 MB to be safe. |
| 429 Rate Limit | More than 3 requests/day or 90/month on free tier | Space out injects or upgrade to Pro (500/month) |
| Request hangs | Camera or API unreachable | Add a catch node on the flow; set HTTP request timeout to 15s |
conditions field absent |
Plant is healthy, or the image isn't cannabis, so no condition was detected | Expected. Guard with payload.conditions && payload.conditions.length – the field is omitted entirely on healthy plants, not returned as an empty array. |
Add a catch node wired to your alerting. When the flow itself breaks, you hear about it. Two weeks of silent green checkmarks on a flow that quietly stopped running is worse than a flow that never ran at all.
Why Node-RED Instead of Writing This in Python
A few reasons.
Protocols come free. MQTT, HTTP, WebSockets, Modbus, CoAP, serial, SNMP – all one node away. Your dosing pump speaks MQTT, your camera speaks RTSP, your logger speaks InfluxDB line protocol, alerts go to Telegram or Discord. Doing that same glue in Python means pulling in four libraries and maintaining them yourself.
Visual flows match the mental model. “When the camera sees X, send Y to the pump and notify me on Z” is already a diagram in your head. Node-RED lets you lay it out on a canvas instead of translating between code and back.
You can change a running flow. Deploy swaps it in place, no restart. Handy for grow-room automation where you tune thresholds based on what the plants actually end up doing, not what you assumed they would.
If you prefer code, the same flow is about 40 lines of Python with requests, paho-mqtt, and a cron entry. Use whichever fits.
What the API Actually Gives You
The response has every field you need for automation. The ones that matter most:
| Field | Type | Notes |
|---|---|---|
is_healthy |
bool | The simplest switch |
is_cannabis |
bool | Guard against pointing the camera at the wrong thing |
conditions |
array | Sorted by confidence, top result first |
conditions[].class_id |
string | One of 31 possible values |
conditions[].confidence |
float | 0.0 to 1.0, maps empirically to real correctness |
growth_stage |
string | seedling / vegetative / flowering |
mulders_hypotheses |
array | Nutrient antagonism explanations |
mulders_hypotheses is the block most growers end up leaning on. If the diagnosis is calcium deficiency but the hypothesis says the real cause is potassium excess, adding more cal-mag makes things worse. That's the kind of tip that saves you a week of chasing the wrong fix. More on nutrient antagonism here.
FAQ
Do I need a dedicated PlantLab Node-RED node?
Not yet. The standard http request node handles it fine. A node-red-contrib-plantlab package is on the roadmap and will collapse the multipart wrapping into one node. Until then, the function snippet above does the job.
How does this compare to the Home Assistant integration?
HA gives you entities and a config flow. Node-RED gives you wires and broader protocol reach. If your setup is already Node-RED-centric, don't force HA into the middle just for this. If you have both, let Node-RED handle the flow logic and use HA webhooks for the notifications that already work well there.
Rate limits?
Free tier: 3 per day, 90 per month. Pro: 500 per month. A home grow with morning and evening checks fits the free tier with a spare daily slot. If you're monitoring multiple tents or running high-frequency checks during flower, Pro is probably what you want.
Does 0.80 confidence really mean 80% certain?
Close to it. Over our evaluation data, a score of 0.80 lines up empirically with about 80% correctness. Worth knowing when you set automation thresholds – a 0.60 threshold fires more often than a 0.80 one, at a predictable cost in false positives. More on how we diagnose here.
Does it handle images from plant apps?
The endpoint accepts any JPEG or PNG. Grow-log app, phone gallery, file drop on a NAS – same POST, same result.
PlantLab detects 31 cannabis conditions – nutrient deficiencies, pests, diseases, environmental stress – at 99%+ accuracy in 18ms. Structured JSON out, works with anything that speaks HTTP. Free tier at plantlab.ai. HA integration is open source at github.com/plantlab-ai/home-assistant-plantlab.