PlantLab's AI doesn't ship once and stop improving. Behind every release is a cycle of automated experiments that audit the model's own predictions, find where it struggles, and fix the root causes before retraining. The latest cycle ran 47 hyperparameter experiments, analyzed 1,081 classification errors, and cleaned data across 1.34 million images. This is what continuous AI improvement actually looks like – no buzzwords, just the work.
Something looks wrong. Maybe the bottom leaves are yellowing. Maybe the tips are curling. Maybe you walked into your tent and something just looked off in a way you can't articulate but your gut knows isn't right.
So you did what every grower does: you took a photo, posted it online, and got twelve different answers. Someone said CalMag. Someone said flush. Someone said “two more weeks.” None of them agreed on what the actual problem is.
This guide won't do that. It walks through a systematic process: look at where the damage is, what it looks like, and narrow it down to a specific cause. No guessing, no bro science, no “could be anything, hard to tell from the photo.”
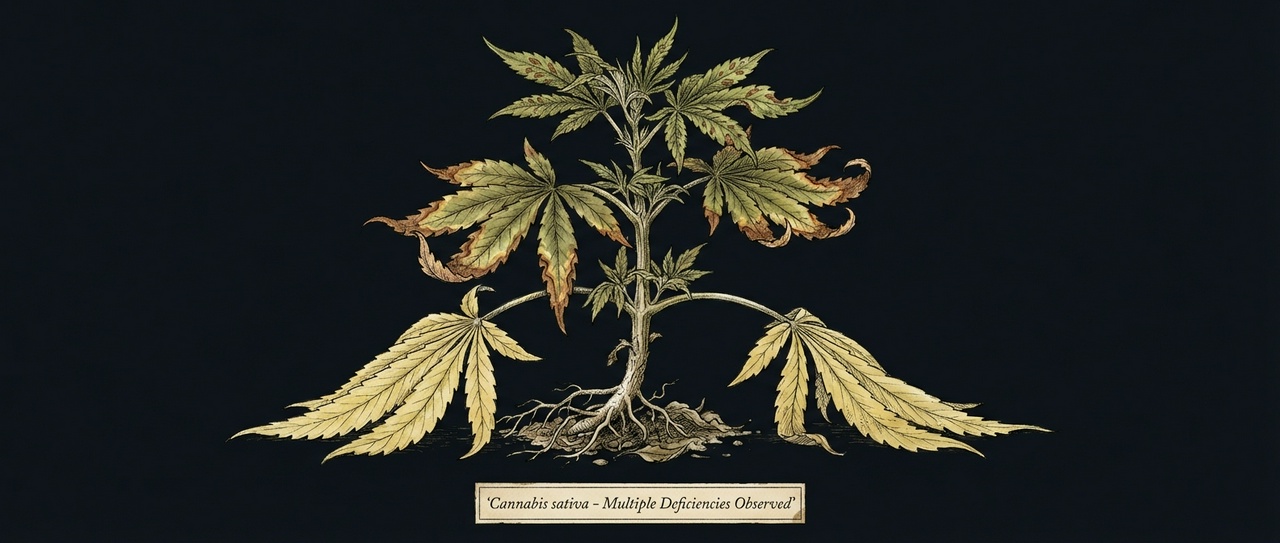
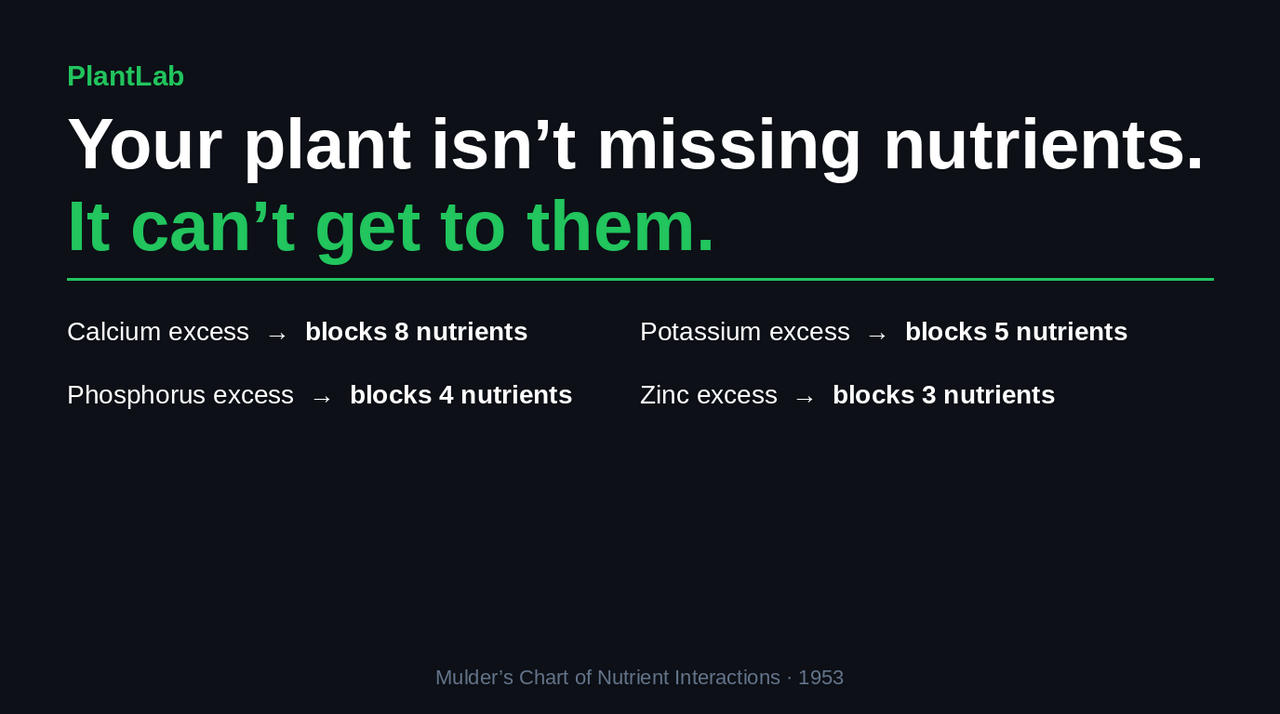
Nutrient antagonism is when excess of one nutrient physically blocks another from being absorbed – your plant has enough of what it needs, it just can't get to it. Adding more of the blocked nutrient usually makes things worse. A 1953 agricultural chart called the Mulder's Chart maps all of these interference relationships; PlantLab's diagnosis now applies that same logic automatically, flagging the most likely excess nutrient in every analysis.
What this post covers:
– Why “add more” is sometimes the exact wrong answer
– The Mulder's Chart: what it shows and how to read it
– The four antagonism traps cannabis growers hit most often
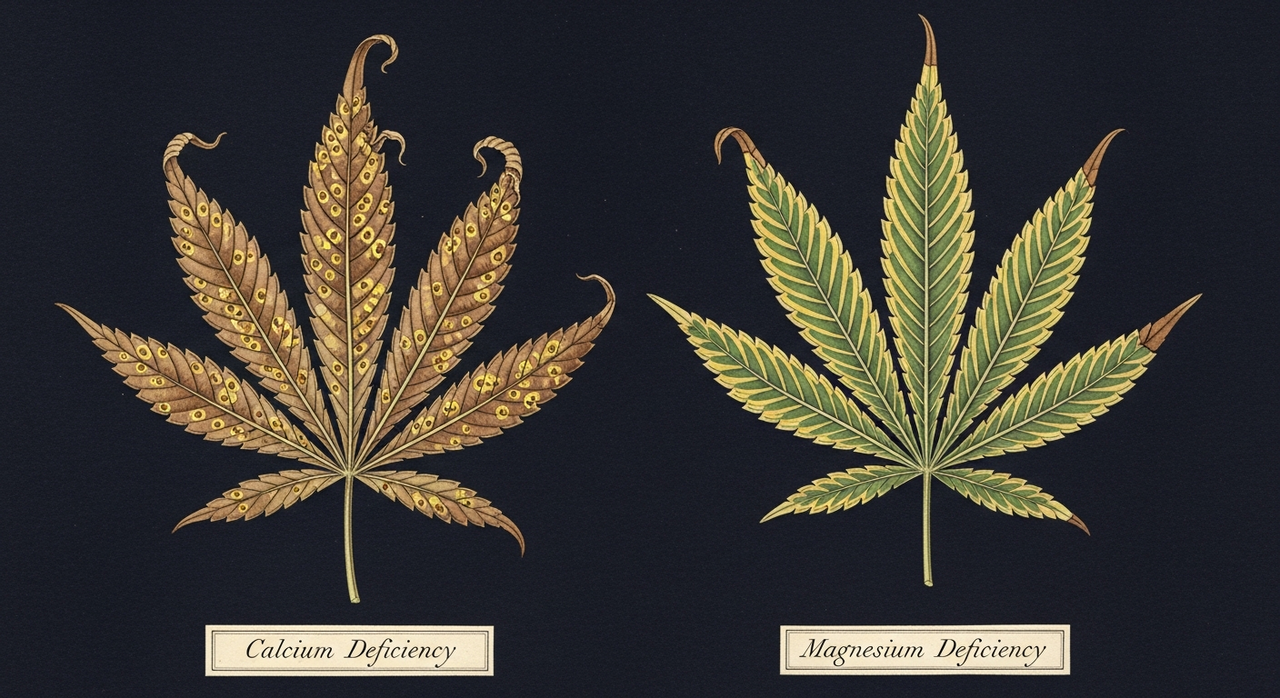
– How to tell antagonism from a true deficiency
– What to actually do once you've identified the likely excess
You're three weeks into flower. New growth is showing interveinal chlorosis – yellowing between the veins. Classic iron deficiency. You've seen it before. You adjust your pH, add some chelated iron, wait a few days. Nothing. You add more. The leaves get worse. Two weeks of this and your runoff EC looks completely normal. What is going on?!
Here's the thing: your plant probably has plenty of iron. The problem is that something else is blocking it from getting in. You're chasing a deficiency that isn't really there.
Most plant diagnosis tools give you a paragraph to read. PlantLab gives your automation system something to act on.
The model covers 31 cannabis conditions and pests at 99.1% balanced accuracy. Balanced means every class counts equally – a system that nails common deficiencies but misses rare pests does not score well. The output is structured JSON that Home Assistant, Node-RED, or a custom controller can read and act on without a person in the loop.
Something's wrong with your plant. The leaves look off. You post a photo to a growing forum and within minutes, three people reply: “CalMag.”
You could have posted a picture of your dog and someone would have said CalMag.
It's the universal answer to every cannabis problem, the “have you tried turning it off and on again” of indoor growing. Yellowing? CalMag. Spots? CalMag. Weird leaf curl? Believe it or not, CalMag. And hey – sometimes it works. But when it doesn't, most growers just add more CalMag, which can make things actively worse.
Nitrogen deficiency in cannabis appears as yellowing of lower, older leaves that progresses upward from the bottom of the plant. Because nitrogen is a mobile nutrient, the plant moves it from old growth to support new leaves. The key diagnostic marker is that yellowing includes the veins – unlike iron or magnesium deficiency where veins stay green.
Quick checklist:
Yellowing starts on BOTTOM leaves
Yellowing includes veins (not just between veins)
New growth at top still green
Leaves may cup upward before falling off
If yellowing appears on top/new growth first, it is NOT nitrogen deficiency.
You backed off the feed. The runoff numbers looked high, the tips looked crispy, so you did what every guide says to do when a plant looks overfed: you gave it less. A week later the leaf edges are worse – browner, drier, curling up like burnt paper.
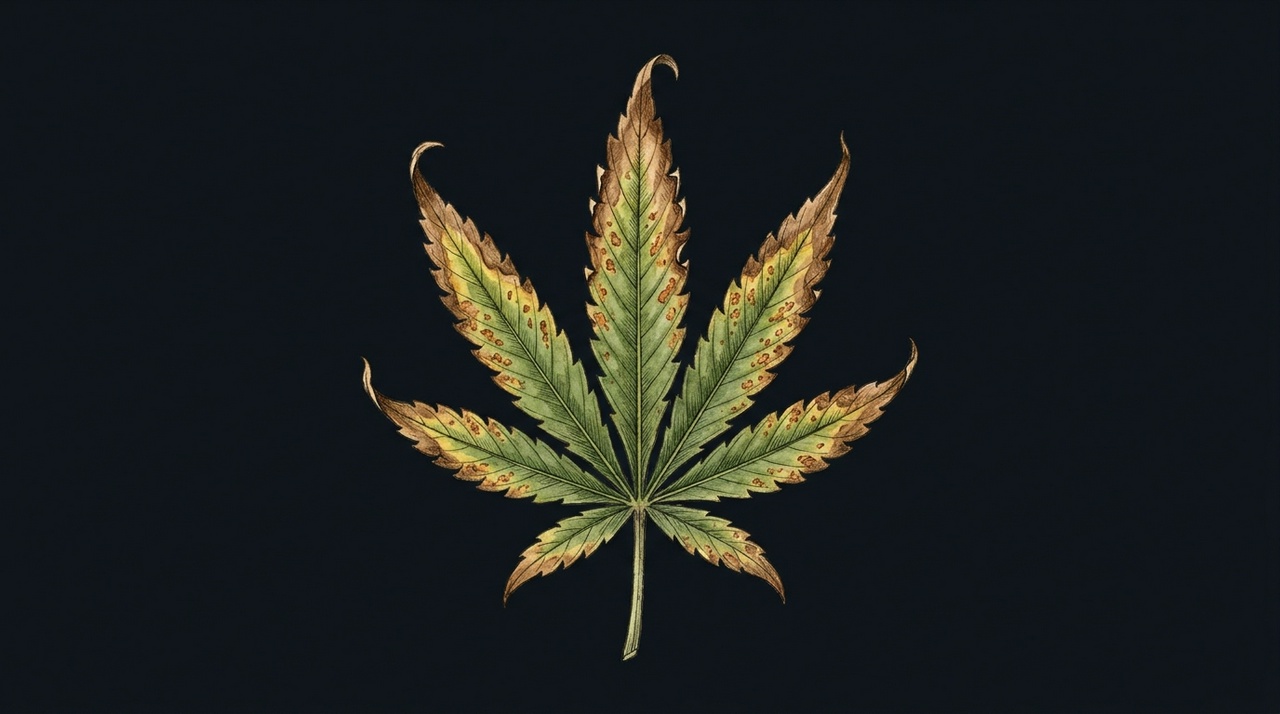
That is the trap with potassium. The classic symptom, scorched leaf margins, looks exactly like the thing you would treat by feeding less. But a potassium-deficient plant is starving, not overfed, and cutting the feed pushes it further down.
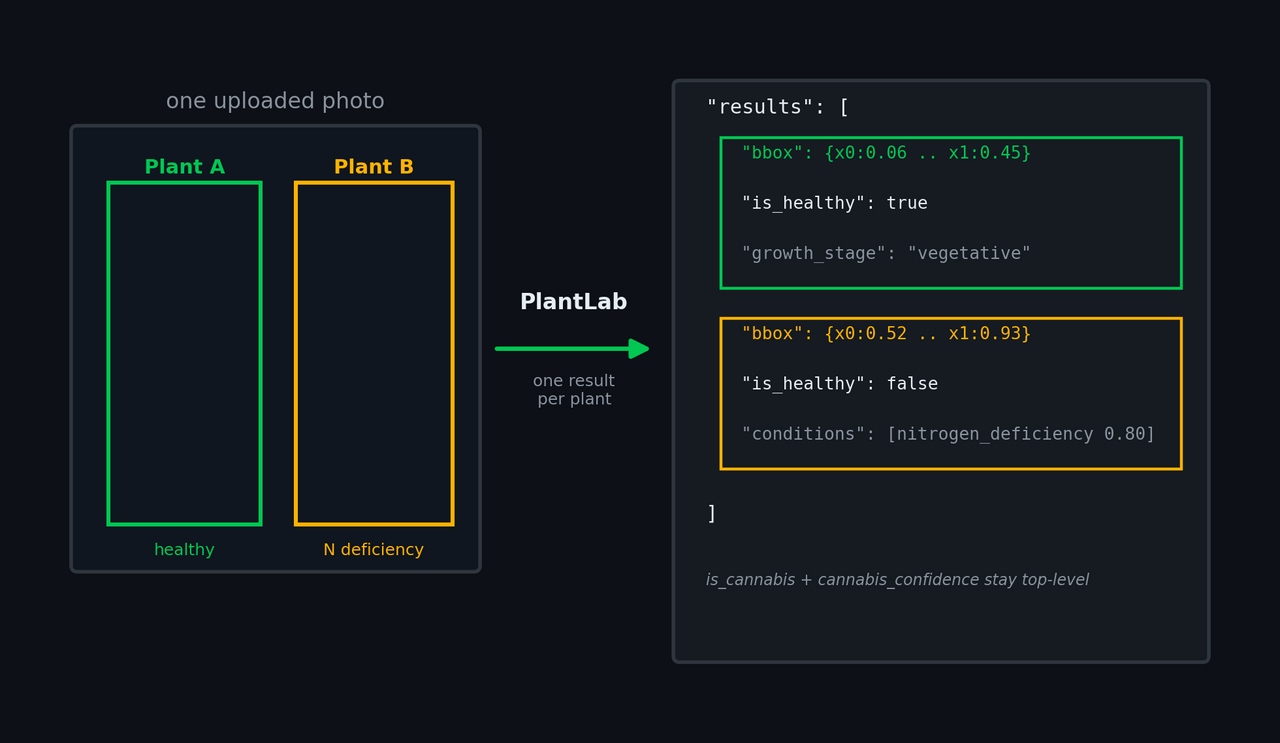
PlantLab can now analyze more than one plant in a single uploaded photo. Instead of forcing the whole image into one diagnosis, the API finds the separable plants, diagnoses each one on its own, and returns a results[] array with one entry per plant.
This is a breaking API change. The response schema is now 3.0.0. Fields like is_healthy, growth_stage, conditions, pests, and reliability_score moved out of the top level and into results[]. Image-level fields such as is_cannabis and cannabis_confidence stay top-level.
If your code already treats a diagnosis as “the answer for this plant,” the migration is simple: iterate results[]. Single-plant photos still return exactly one result.
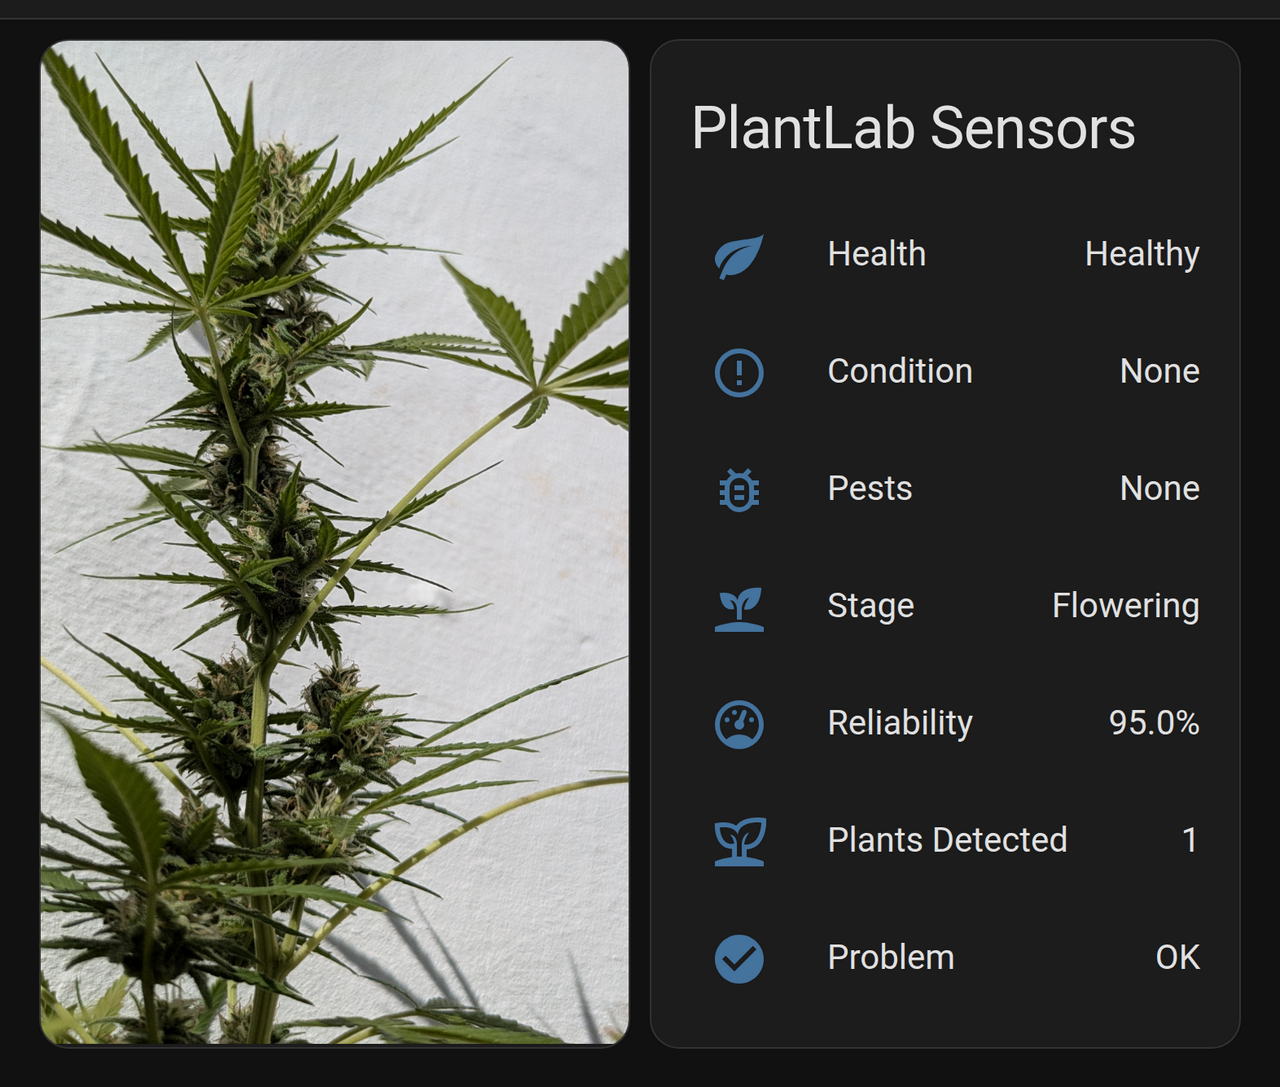
A camera watches your plants on a schedule. Each photo goes to an AI trained only on cannabis, and Home Assistant turns the answer into sensors you can automate against. Something looks off, your phone buzzes with the diagnosis and the photo. Everything's fine, it stays quiet.
Setup runs about 20 minutes. The cost is a camera you probably already own plus PlantLab's free tier – three diagnoses a day, no card. No soldering, no standalone Python scripts. A Home Assistant integration and some YAML.
AI plant health diagnosis is having a moment – grow cameras with “AI” on the box, phone apps that name a deficiency from one photo, controllers that promise to read your plants for you. Most of them report a confidence number they haven't earned, because the hard part of AI plant diagnosis isn't producing an answer. It's knowing when the answer is wrong, and proving the accuracy you claim on photos the model has never seen. June at PlantLab was a research-and-hardening month spent almost entirely on that second problem: catching my own model being wrong before a grower could. This is what that looks like from the inside, with the numbers.